The article last week by me had assessed the projections made for 2019-20 by the IMF staff following the First Review. This article analyses the projections for the last two years of the Program, 2020-21 and 2021-22. The IMF projections for the next two years are compared with the projections which emerge from the Macroeconomic Model of Pakistan built at the Beacon house Center for Policy Research (BCPR). This model has 73 equations and is of a recent vintage. It is based on time series data from 1990-91to 2018-19.
The macro economy is driven by some key variables like the exchange rate, interest rate, level of fiscal effort in the form of additional taxation, level of development , defense and other spending, sources of financing of the budget deficit, level and composition of external borrowing for meeting the external financing requirements of external debt repayment and the current account deficit.
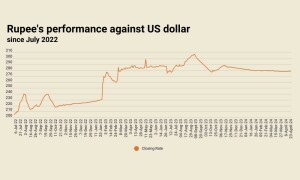
The surprise is that the IMF has opted to make big changes in some of these variables on the basis of developments in the economy in the short period of five months from July to November 2019. The changes in the projected exchange rate are shown in Table 1.
====================================
The Projected Exchange Rate
(rounded off to the nearest Rupee,
average for a year)
====================================
                              (Rs/$)
====================================
            Original     After First
            Projection        Review
====================================
2019-20       173                161
2020-21       183                169
2021-22       192                172
====================================
The real effective exchange rate is now expected to fall less in 2020-21 and 2021-22. The earlier projection in July 2019 had projected that the real effective exchange rate would fall cumulatively from 2018-19 to 2021-22 by over 15 percent. Now, it is anticipated that the extent of depreciation will be much less at 7 percent over the three-year period and the rupee could actually appreciate in 2021-2022. This is perhaps due to the optimism resulting from a much faster decline in the first six months in the current account deficit from July to December 2019 of 75 percent. The earlier exchange rate depreciation has, no doubt, played a major role in reducing the current account deficit.
Table 2
====================================
The Projected Interest Rate
====================================
                                 (%)
====================================
            Original     After First
            Projection        Review
====================================
2019-20     15.4                13.0
2020-21     15.1                12.5
2021-22     14.6                11.8
====================================
(ii) The nominal interest rate, as measured by the cost of domestic debt servicing, is also projected at a lower rate in each year, as given in Table 2.
(iii) There has been only a marginal change in the level of fiscal effort in the Program Period. The earlier projection was that the tax-to-GDP ratio would have to be raised from 11.6 percent in 2018-19 to 17 percent by 2021-22. Now the terminal year target has been reduced by 0.3 percent of the GDP to 16.7 percent of the GDP.
The above changes clearly highlight that the IMF has realized that stabilization of the economy will require less intensive use of policy instruments, especially the exchange rate and the interest rates. However, the targeted increase of over 5 percent of the GDP in the tax-to-GDP ratio in three years remains well beyond the realm of possibilities.
The BCPR Macroeconomic Model has been given the input of the above variable magnitudes, with the only change that the target increase in the tax-to-GDP ratio will be 3 percent and not over 5 percent of the GDP.
The resulting projections of key macroeconomic variables which emerge by simulation of the model are compared below with the latest projections by the IMF. First, a comparison is made of the projected current account and budget deficits. The projections of the current account deficit are as follows:
==============================================================
Projected Current Account Deficit - ($ billion)
==============================================================
                   2018-19     2019-20     2020-21     2021-22
==============================================================
Current Account Deficit
IMF                  -13.8        -6.6        -5.9        -5.9
BCPR Model           -13.8        -6.5        -8.0       -10.9
Difference               0         0.1        -2.1        -5.0
==============================================================
Therefore, the IMF projections are on the optimistic side given the exchange rate projection. Exports are expected to show cumulative growth of 23 percent from 2018-19 to 2021-22, while imports will fall by 2 percent. However, the model forecasts that exports will rise by 14 percent over the three-year period, while imports could rise, not fall, by 7 percent. Consequently, the current account deficit will be $2.1 billion larger than the level anticipated by the IMF in 2020-21 and by $5 billion in 2021-22. There is a real risk that the stabilization process could unwind by 2021-22.
Why are imports, in particular, likely to be significantly higher? According to the model, for every 1 percent increase in the real GDP, imports rise in volume terms by 0.9 percent. If, as projected, the GDP cumulatively increases by almost 10 percent over the Program Period, then this would imply that imports would rise by 9 percent due to the income effect. The devaluation of the rupee will create a negative price effect on imports of 0.2 percent for one percent depreciation in the exchange rate. It appears that the projected level of imports will be higher, because the positive income effect will dominate over the negative price effect, given the extent of depreciation projected of the Rupee.
We turn now to the projected primary deficit in the Budget. Therefore, given a more feasible increase in the tax-to-GDP ratio the primary deficit is likely to be significantly larger. It is likely to be transformed only into a surplus only in 2021-22.
==============================================================
Projected Primary Deficit - (% of GDP)
==============================================================
                   2018-19     2019-20     2020-21     2021-22
==============================================================
IMF                   -3.5        -0.6         0.9         1.9
BCPR Model            -3.5        -1.4        -1.0         0.1
Difference               0        -0.8        -1.9        -1.8
==============================================================
The slower pace of stabilisation will have significant implications by 2021-22 on key variables like the foreign exchange reserves and level of external debt. The IMF staff projection is that foreign exchange reserves will reach $ 20.7 billion by 2021-22. However, the BCPR Model expects reserves to be limited to $11.7 billion only in 2021-22.Therefore, the objective of achieving sufficient stabilization of the economy by the end of the Program to enable the economy to move on a trajectory of higher growth may not be achieved.
The IMF has clearly has made significant changes in six months in terms of the intensity of use of key stabilization variables. The BCPR Model indicates that the optimal stabilization strategy is, first, adherence to the new exchange rate projection for 2019-20 and somewhat higher than the original percentage increases in 2020-21 and 2021-22 of 6 and 5 percent respectively. Second, the new lower level of interest rates can be lowered further by 1 to 2.5 percentage points, as the Program proceeds, in view of the falling rate of inflation in later years. Third, the Program should aim for the increase in the tax-to-GDP ratio of 3 percent of the GDP by 2021-22. This will make the Program more feasible and increase the probability of stabilization being achieved, thereby enabling the economy to move on to a trajectory of higher growth.
(The writer is Professor Emeritus at BNU and former Federal Minister)
The writer is Professor Emeritus at BNU and former Federal Minister


Comments
Comments are closed.