

J. A. Textile Mills (PSX: JATM) was established in 1987 under the Companies Ordinance, 1984. However, it did not start commercial production until 1992. Its mill is situated in Faisalabad with 21,384 spindles, producing 100 percent cotton yarn and PC yarn. With a market capitalization of close to 41 million, the company is present in both, the local market as well as the international market.
Shareholding pattern
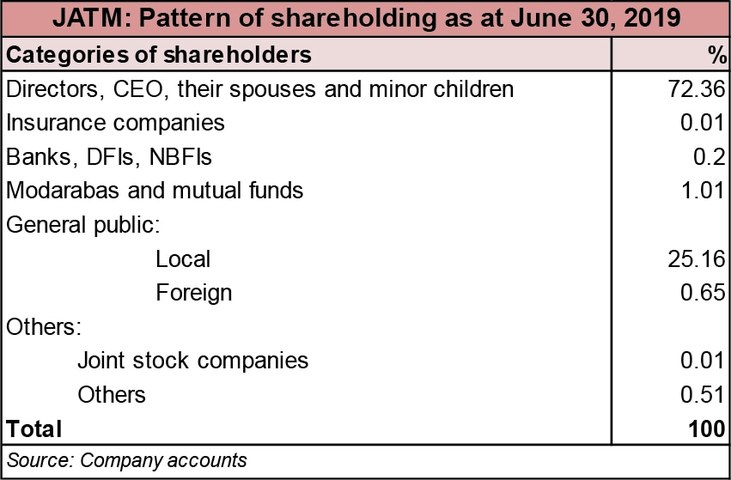
J. A. Textile Mills is largely owned by the directors, CEO, their spouses and minor children, owning about 72 percent of the shares. Around 55 percent of the total shareholding is owned by Mr. Zahid Anwar, one of the directors of the company. Around 25 percent is distributed with the local general public. The remaining about 3 percent is distributed between the rest of the categories.
Historical operational performance
The company’s performance has been rather fluctuating, with topline reducing until FY16 when it reached its lowest, increasing for two years and again seeing negative growth in FY19. Profit margins have followed the same trend; dipping in FY16, growing for two years and remaining flat year on year in FY19.
In FY15, topline declined by close to 22 percent. This decline was attributed to a decline in yarn prices. This was a result of cheaper imported yarn from India which was entering the country duty free. This caused the prices of locally produced yarn to drop as well. In addition, the company was exporting in FY14, which was absent from here on. Cost of production mirrored previous year’s trend of exceeding sales revenue, causing gross margins to be negative. Raw material expense was the major cost driver; it made up 64 percent of the total cost. Although other income increased, it made a small part of the revenue. Although margins were negative, they had improved year on year.
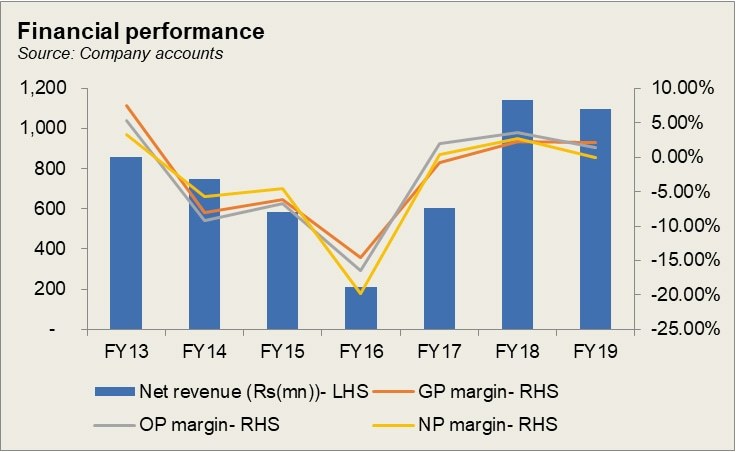
The company saw its lowest topline in FY16 as it declined by more than 50 percent. The whole textile industry overall, saw a significant decline in its business in FY16, reflected in a lot of the companies’ financials. The yarn segment of the industry in particular saw a notable adverse effect as globally there was a case of over supply which drove down prices, while demand also remained low. The lower revenue did not allow for absorption of costs which meant that cost of production exceeded the revenue. With most other factors remaining unchanged, profit margins fell further.

Some recovery was seen in FY17 as revenue increased by nearly three times year on year. However, demand still remained low and the industry was suffering; more so the spinning segment. China to which Pakistan exports the most had shifted its demand from Pakistan to India which offered cheaper yarn. In the domestic market as well, the manufacturers preferred the cheaper imported yarn form India which impacted local sales as well. However, higher production brought with it, higher costs, which still exceeded revenue, leading to a gross loss. However, at Rs 23 million, other income allowed the company to conclude the year with a positive net profit figure. During FY17 the company also increased production capacity.

Growth continued during FY18 as topline nearly doubled year on year to reach a little over Rs 1 billion. In the absence of exports, the increase in revenue was sourced from domestic market sales. Both yarn sales and waste sales increased significantly. The spinning segment had seen the most decline in global demand, due to which a lot of the yarn manufacturers had shifted their focus to sell in the domestic market, finding better margins locally. Cost of production was curtailed to some extent, but it was still high, consuming nearly 98 percent of the revenue. The major increases in costs were seen in raw materials expense, salaries and wages expense which nearly doubled, and fuel expense which also a noteworthy climb. Other income which largely came from “balances written off” under the non-financial assets category, kept the company afloat, with a net profit of Rs 31 million, the highest seen.

Revenue declined marginally by around 4 percent with yarn sales seeing a decline, and waste sales witnessing an increase, rather. Cost of production, on the other hand, remained maintained its consumption of 97 percent of the revenue. Raw material expense which made up 64 percent of the total cost in FY15, made up more than70 percent in FY19. The country had seen a drop in cotton production in FY19 as indicated by a Gallup publication, which meant that the local spinning mill owners may have had to import the requirement. With currency depreciation, imported raw material expense is meant to increase. Thus, the year ended with only a nominal profit.
Quarterly result and future outlook
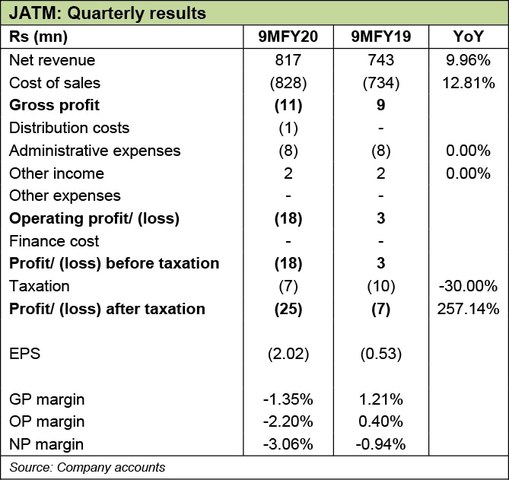
Topline grew by nearly 10 percent year on year during 9MFY20. However, cost of production marred profitability, as the former increased to exceed revenue. With no significant change in other factors, the company incurred a loss of Rs 25 million. This would be further aggravated in the FY20 financials with the last quarter seeing most of the decline due to Covid-19 and the resultant lockdown. It also has not helped that the country faced a poor cotton crop, and over the last two decades, the area under cotton production has also reduced. Without a major cost curtailment and with the ongoing pandemic and the resultant slowdown in business activity, it seems unlikely for the company to see profitability.


Comments
Comments are closed.